AN217
14 Rev. 0.2
4.1. Effective Resolution
Many ADC applications measure a dynamic signal in the presence of noise. Noise sources include the ADC itself
and external sources, including the voltage reference. Additionally, the analog-to-digital conversion process itself
introduces quantization error as the ADC must “choose” from a finite set of output codes to represent an analog
voltage input. Quantization error is also viewed as input referred quantization noise. If the noise is white, the
collected samples’ distribution will approach a Gaussian distribution for a dc voltage input (or if the inputs are
grounded for a noise test); therefore, the rms noise is one standard deviation of the collected samples. (See
Figure 7 on page 13.)
Delta-sigma converter noise is often specified using rms noise. This noise is typically given for a set of typical ADC
configurations as a function of gain and decimation ratio, as an input-referred voltage. Noise specified in this way
gives the designer a good idea of the expected ADC noise in a measurement for a given gain and output word rate.
This noise information can be used to calculate the effective resolution of the ADC.
Noise can be observed in a measurement as the LSBs of the ADC output vary from sample-to-sample. Some may
consider these bits to be useless and dismiss them when making a measurment. However, these LSBs do contain
useful information and improve performance in many applications. Such applications are those that measure a
dynamic or time-varying signal (e.g., audio applications). Often an engineer will average a number of samples to
increase the effective resoution by filtering noise (the averaging is a form of digital filtering).
4.2. Noise-Free Resolution
While using rms noise to give an effective number of bits is useful, many applications measure a static, dc-like
signal such as temperature or pressure for display. In such cases, the designer will be more interested in the peak-
to-peak or noise-free bits that do not change from sample-to-sample. For example, the designer may want to
display a digital temperature readout and needs to determine the number of digits that could be displayed. This is a
more stringent requirement and can be calculated from the given rms noise value in the data sheet.
The rms noise is one standard deviation (sigma), and 99.9% of all samples within a Gaussian distribution are within
6.6 – sigma. Multiplying sigma by 6.6 will allow the calculation noise-free bits in an ADC for a given configuration.
When comparing ADCs, it is important to note which specification is posted in the data sheet so that a meaningful
comparison can be made.
4.3. Example: Effective vs. Noise-Free Resolution
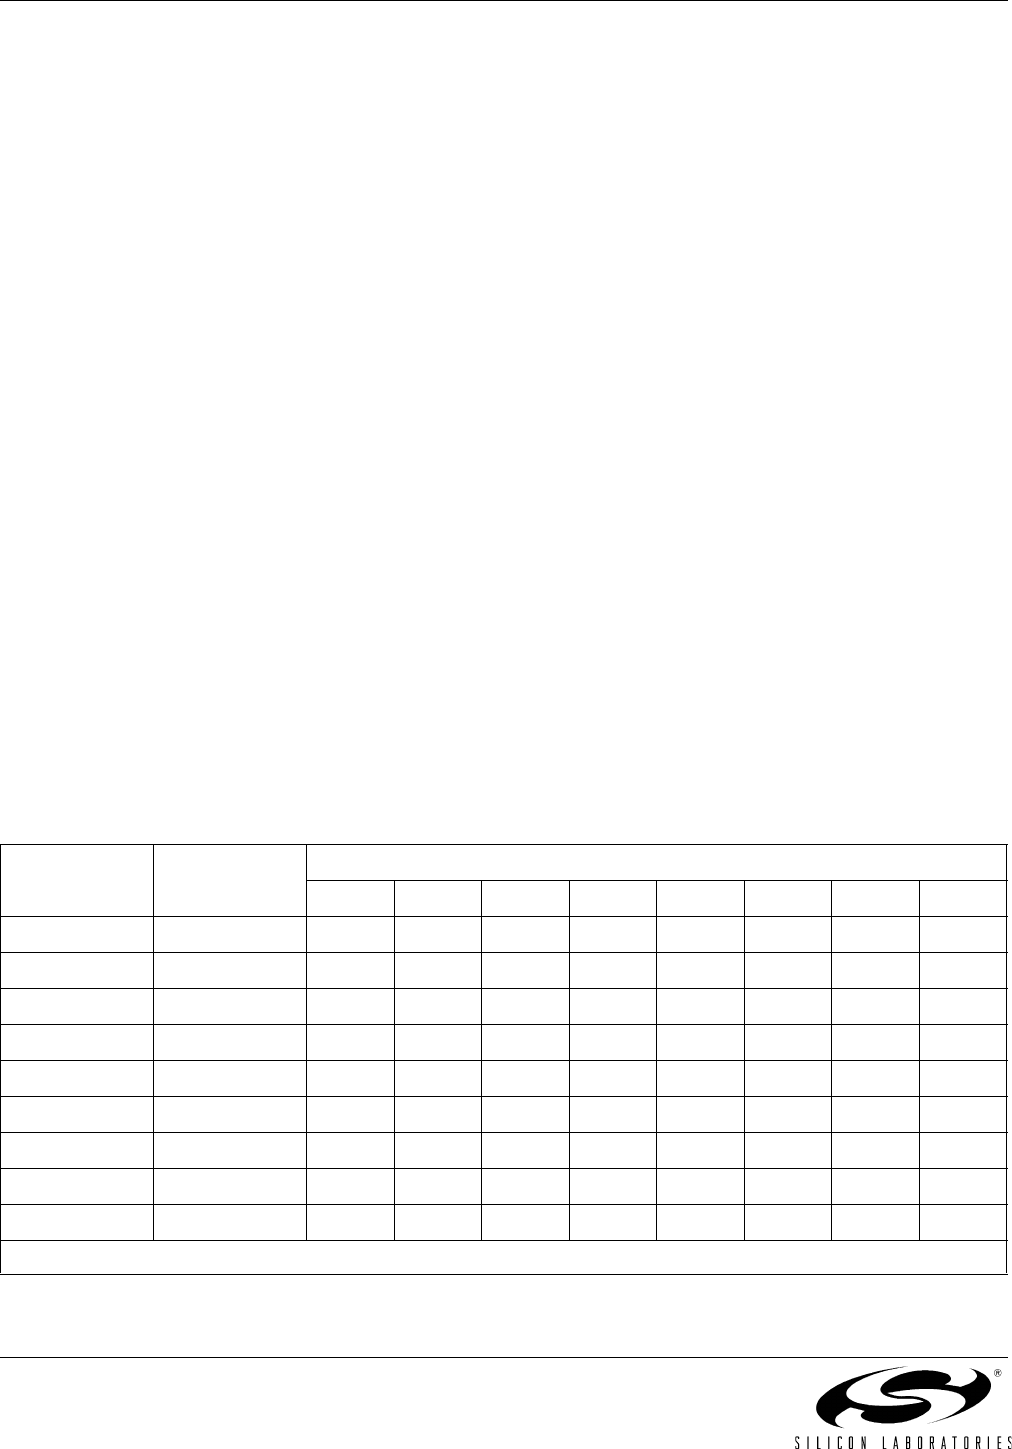
Table 1. ADC0 SINC3 Filter Input-Referred Typical rms Noise (µV)
Decimation
Ratio
Output Word
Rate*
PGA Gain Setting
1 2 4 8 16 32 64 128
1920 10 Hz 2.38 1.23 0.68 0.41 0.24 0.16 0.12 0.11
768 25Hz 3.902.041.140.680.440.330.280.27
640 30Hz 4.502.391.310.810.540.420.360.36
384 50Hz 6.003.211.861.200.860.730.660.66
320 60 Hz 7.26 3.96 2.32 1.51 1.11 0.97 0.89 0.89
192 100 Hz 13.1 7.11 4.24 2.85 2.16 1.91 1.79 1.77
80 240Hz 93.247.724.813.99.347.616.976.67
40 480 Hz 537 267 135 69.5 38.8 25.7 20.9 18.9
20 960 Hz 2974 1586 771 379 196 108 70.0 45.4
*Note: Output Word Rate assuming Modulator Clock = 2.4576 MHz (sampling clock = 19.2 kHz)
 Manymanuals.com
 Manymanuals.de
 Manymanuals.fr
 Manymanuals.it
 Manymanuals.pl
 Manymanuals.cz
 Manymanuals.es
 Manymanuals-pt.com
Comments to this Manuals